Insights
Isara Insights turns your full history of support interactions into a clear picture of how your AI agent is performing
Support leaders should not have to wait for a spike in churn to understand that something has been going wrong for weeks.
Insights gives you a historical view of sentiment, topic trends, and satisfaction patterns across all your AI agent conversations, so you can identify and address issues before they compound.
Topics
Find out why customers are struggling with your AI agent, not just that they are
Standard reporting tells you what happened. It rarely tells you why.
Isara automatically tags every AI agent conversation by topic, tracks sentiment alongside it, and flags areas where concern is building in real time.
Whether it is a recurring product issue, a process gap, or a pattern of interactions your AI agent is consistently failing to resolve, Topics surfaces the underlying cause so your team can fix it rather than manage around it.

Predicted CSAT
A satisfaction score that reflects every customer your AI agent speaks to, not just the ones who fill in surveys
Traditional CSAT captures the responses of a small, self-selected group. It leaves out the customers who were dissatisfied enough to stay silent, and it tells you nothing about the conversations your AI agent is handling at scale.
Predicted CSAT analyses the tone, language, and engagement patterns of every AI agent interaction to produce a satisfaction score that represents your full customer base. It gives support leaders a more honest read on how the agent is performing and where to focus improvement efforts.

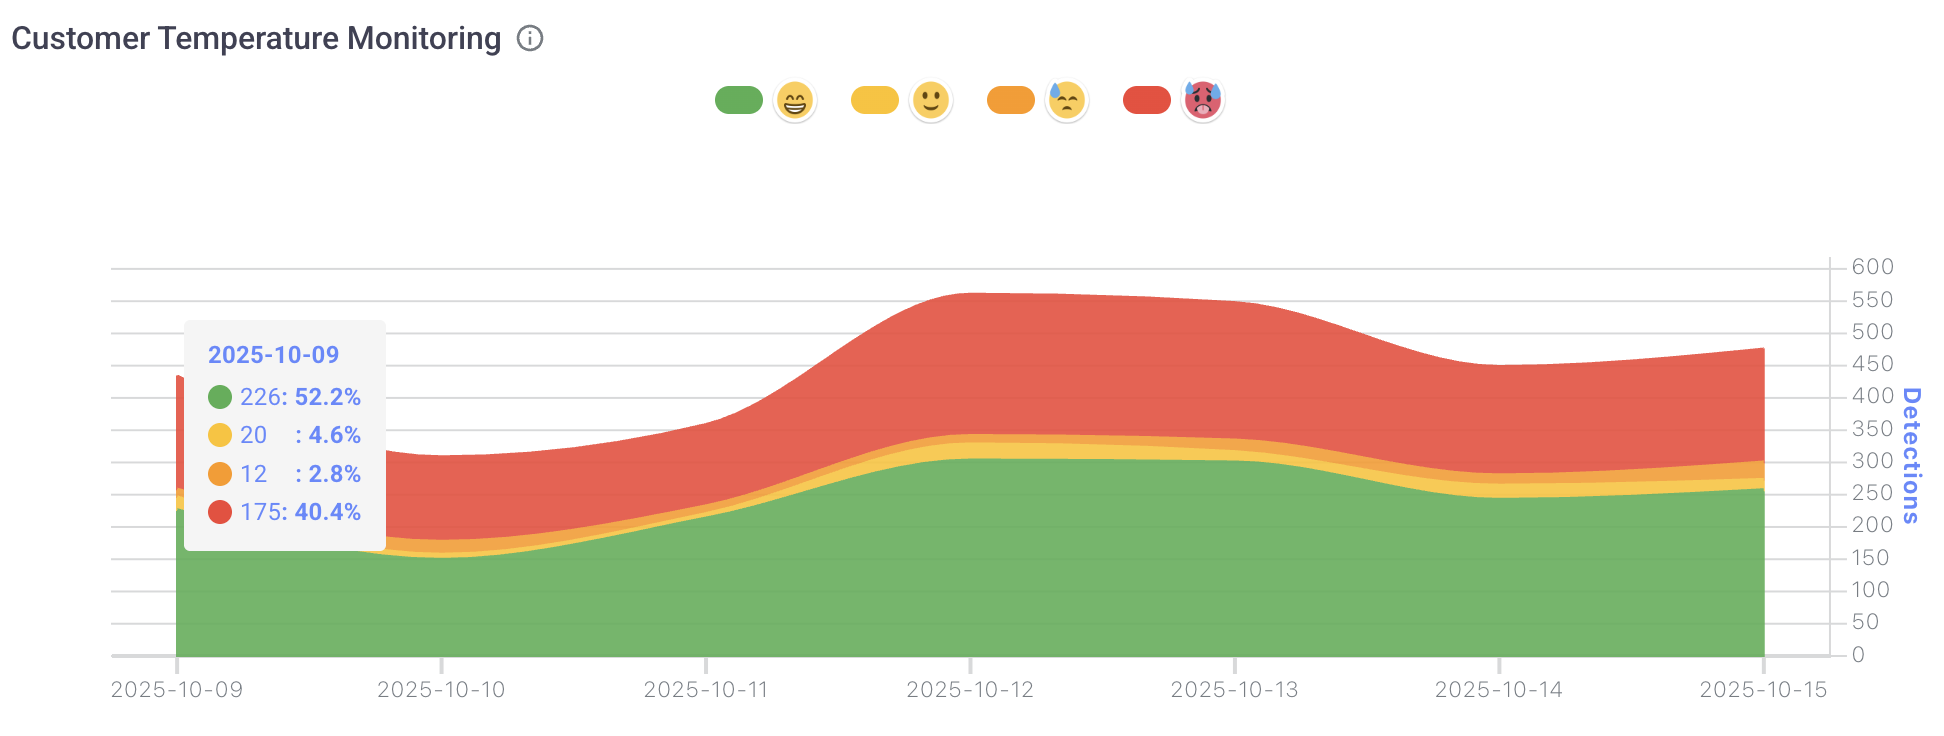
Customer frustration over time
Spot sentiment shifts in your AI agent conversations before they become churn signals
A single frustrated customer is a support issue. A sustained rise in frustration across your AI agent interactions is a strategic one.
Isara tracks the emotional tone of every AI agent conversation over time, surfacing the trends and spikes that indicate something systemic is developing in how your agent is handling customers. Teams can monitor long-term sentiment patterns and act on what they see before it reaches the point of customer loss.